
Introducing Beacon: Endpoint Telemetry for AI Agents
Making local AI agent activity observable, understandable, and governable.

The first generation of AI security centered on the model gateway. The next will move to the endpoint, where agents actually do the work.
Gateways made sense when AI systems mostly answered questions. A security team could put a control point between the user and the model, inspect prompts and outputs, enforce DLP, mediate model access, and log the exchange.
Agents force that architecture to evolve. The security problem is no longer just what a model says or sees. It’s what an agent can do: use the user’s tools, inherit their permissions, and change state inside sensitive environments.
The clearest example is the developer machine. Coding agents like Claude Code, Codex, and Cursor run alongside source code, terminals, package managers, cloud CLIs, local credentials, and production-adjacent systems. A single natural-language request can turn into file reads, shell commands, dependency changes, credentialed actions, and code modifications.
That same pattern is now expanding beyond developers to knowledge workers. Desktop-connected agents are beginning to operate across SaaS apps, local tools, and internal systems. Agent workspaces like Claude Cowork and OpenClaw point to the next phase of enterprise AI: the user’s laptop becomes the runtime for delegated work across enterprise applications.
The hard reality today is that security teams may only see the blast radius after an agent has executed commands, modified files, installed dependencies, or exfiltrated data. The failure modes are already severe: remote code execution through Claude Code project configuration, private code exposure through Copilot Chat prompt injection, and credential theft through malicious npm packages that turn local coding agents into attack paths.
That is the endpoint visibility gap Beacon is built to close.
Beacon is Asymptote’s open-source endpoint telemetry layer for AI agents. It is our first step toward making local agent activity observable, understandable, and eventually governable across the enterprise.
What This Means for Security Teams
For security teams, this matters because the existing stack was not designed to explain delegated work. Gateways, EDR, and agent-native telemetry all remain important, but each sees only part of what an agent is doing. To govern agents safely, teams need to see how an agent moves from intent to action on the endpoint.
Three gaps stand out:
Endpoint logs show effects, not workflows. They can capture commands, file changes, and process activity, but they rarely connect those events back to the agent request, tool decision, approval path, or final diff.
Agent telemetry needs a common layer. AI coding agents like Claude Code, Cursor, Codex, and Claude Cowork all expose different telemetry signals. Security teams a unified endpoint-level record across them.
Visibility comes before control. Teams cannot enforce configurations, gate sensitive actions, govern MCP access, or protect secrets until they know which agents are running, what permissions they have, and what actions they are taking.
Endpoint Logs Don’t Capture Agent Workflows
Traditional endpoint telemetry is necessary, but insufficient for understanding agent behavior.
It can show that commands ran, files changed, processes spawned, or connections opened. What it usually cannot show is the workflow behind the event: what the agent was asked to do, what it decided to do, and whether the action made sense for the task.
The same agent action can be safe or risky depending on the task around it. For example:
A kubectl command may be appropriate during an infrastructure incident, but inappropriate for a coding agent asked to update a unit test.
A .env read may be expected during local debugging, but suspicious during a documentation edit.
A Terraform change may be normal in an infrastructure repo, but dangerous when introduced as a side effect of a dependency update.
In each case, the raw event is not enough. The security meaning depends on the workflow around it: the prompt, the plan, the context accessed, the tools invoked, the files touched, the credentials used, and the approvals granted.
Consider a coding agent asked to make a narrow test change: The user request might look something like: “Update the unit test for the billing retry logic.”
Traditional telemetry might show:
10:42:11 grep -R “retry” src/ tests/

10:42:24 modified tests/billing/retry.test.ts

10:42:39 read .env

10:42:52 modified terraform/production.tf

10:43:08 ran kubectl apply -f deployment.yaml
Those events are useful, but they are disconnected from the agent workflow. The log shows that a test changed, a secret file was read, Terraform was modified, and a deployment command ran. It doesn’t show whether those actions were part of the user’s request, which tool decision produced them, or whether the user approved the sensitive steps.
An agent-aware record connects those same events back to the workflow:
Agent: Cursor
Device: justin-macbook-pro
Repo: github.com/acme/billing-service

User request: “Update the unit test for the billing retry logic.”

Agent steps:

10:42:11   Searched for retry-related code

           Tool: shell

           Command: grep -R “retry” src/ tests/

...

10:43:08   Ran a deployment command

           Tool: shell

           Command: kubectl apply -f deployment.yaml

           Approval: none recorded

Final diff:

- tests/billing/retry.test.ts

- terraform/production.tf
Without that trace, security teams are left reconstructing intent from low-level artifacts after the fact. They can see the effects of agent activity, but not whether the agent’s behavior was appropriate for the work it was asked to do.
Beacon: An Endpoint Telemetry Layer for AI Agents
Most security and IT teams can answer which models are approved or which gateways are deployed. Once agents run locally, the security questions move closer to the endpoint:
Agent inventory: Which agent tools are installed? Which users and devices are running them?
Runtime context: Which repositories and workspaces are agents operating in? Which tools, credentials, and local permissions can they inherit?
Agent activity: What files are agents reading or modifying? What commands, approvals, and diffs are they generating?
Telemetry and audit: What telemetry is being collected and where is it being sent? Can security teams connect the original user request to the actions taken?
Agent-native telemetry helps, but it’s fragmented. Claude Code and Codex can export OpenTelemetry. Cursor exposes hooks for sessions, prompts, tool use, command execution, approvals, MCP-like activity, and file edits. Claude Cowork can export telemetry through an admin-configured OTLP endpoint.
What security teams need is a workflow record that spans them: what the agent was asked to do, what context it had, what tools it invoked, what approvals were required, and what changed on the endpoint.
Beacon fills that gap by configuring OpenTelemetry where supported, collecting local signals where available, and mapping fragmented agent activity into a common endpoint event format.
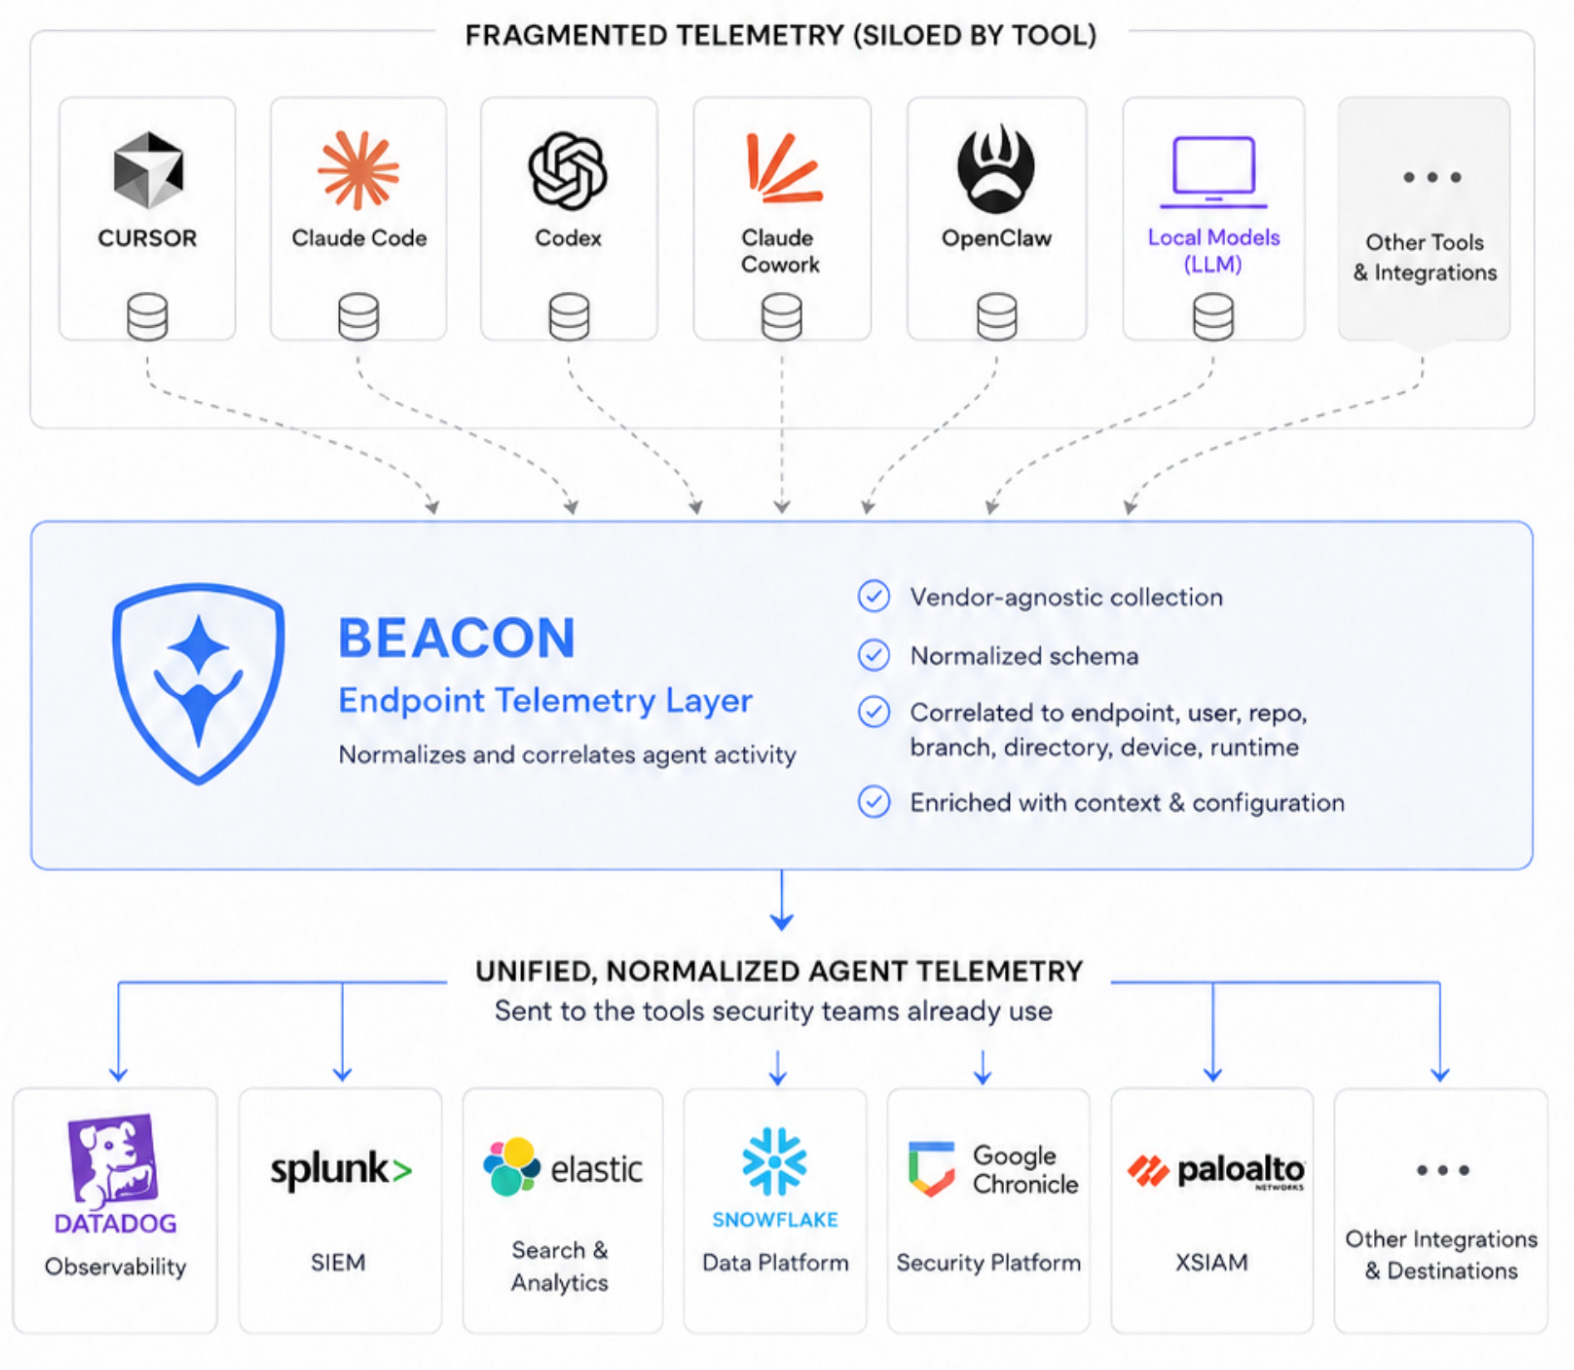
As shown in Figure 1, Beacon connects four layers:
Agent runtimes: Claude Code, Codex, Cursor, Claude Cowork, OpenClaw, and local models generate prompts, plans, tool calls, approvals, diffs, and runtime state.
Endpoint activity: Those agents interact with the machine: files, terminals, package managers, MCP servers, cloud CLIs, repositories, credentials, and local configuration.
Beacon normalization: Beacon turns fragmented OpenTelemetry, hook-based, and endpoint signals into a common JSON event stream, so security teams can follow the chain from agent request to local action.
Security destinations: Beacon writes Wazuh-compatible JSONL today. The same normalized event stream can extend into the SIEMs, data lakes, observability platforms, detection pipelines, and endpoint workflows enterprises already use.
With Beacon, prompts, tool calls, commands, file edits, approvals, MCP interactions, and runtime changes become part of one endpoint-level record: a clearer chain from user request to local action, across agents and tools.
Visibility First, Control Next
Agents are becoming a new execution layer inside the enterprise.
They read files, call tools, use credentials, modify systems, and act with the authority of the people who delegate work to them. That activity cannot be understood or governed from the model gateway alone.
The endpoint is where agent context, authority, and action come together. It is where prompts become commands, tools inherit permissions, credentials get used, and changes are made.
That makes endpoint telemetry the foundation for agent security.
Beacon makes local agent activity observable across the tools enterprises are already adopting. It gives security teams a common record of what agents were asked to do, what they touched, what they changed, and whether sensitive actions were approved.
This layer has to be trusted. Beacon is open source and MIT-licensed because it runs close to developer workflow, source code, credentials, and production-adjacent systems. Developers should be able to inspect what is collected. Security teams should be able to verify the telemetry. IT teams should understand exactly what they are deploying.
Agent activity should be observable before it is governable.
Beacon is our first step toward making that true.
Beacon is open source.
Star it on GitHub to support open endpoint telemetry for AI agents.